The K7RA Solar Update
Tad Cook, K7RA, Seattle, reports: Sunspot activity was substantially lower this week, but new sunspot groups emerged on December 31, January 1, January 4, and January 5. Average daily sunspot number dropped from 110.1 to 36.4, while average daily solar flux went from 124 to 91.4.
Geomagnetic activity was still fairly quiet, even with a number of flares and coronal mass ejections (CMEs), with average daily planetary A index changing from 6.4 to 7.7, and average middle latitude A index from 4.4 to 6.
Predicted solar flux over the next month shows 10.7-centimeter flux values peaking at 120 on January 16 – 24, and again at 120 in mid – February. The daily predicted values are 94 on January 7; 96 on January 8 – 14; 115 on January 15; 120 on January 16 – 24; 110 on January 25; 100 on January 26 – 27; 95 and 90 on January 28 – 29; 88 on January 30 – 31; 85 on February 1 – 5; 90, 95, and 100 on February 6 – 8; 115 on February 9 – 11, and 120 on February 12 – 20.
Predicted planetary A index is 5 on January 7 – 8; 12, 14, and 8 on January 9 – 11; 5 on January 12 – 14; 8 and 12 on January 15 – 16; back to 8 again on January 17 – 18; 5 on January 19 – 22; 10 on January 23; 8 on January 24 – 26; 5 and 10 on January 27 – 28; 8 on January 29 – 30; 5 on January 31 – February 6; 10 on February 7 – 8; 5 on February 9 – 10 and 8, 12, 8, and 8 on February 11 – 14.
Here is the “Weekly Commentary on the Sun, the Magnetosphere, and Earth’s Ionosphere — January 6, 2022” from F.K. Janda, OK1HH. This is a continuation of Earth’s magnetic field activity predictions published between 1978 and 2022.
Solar activity is declining as expected. The last of the chain of active areas on the sun, which gradually set behind the western limb of the solar disk, still contributed to the increase in the speed of the solar wind in the first 3 days of the new year.
Magnetic field activity has decreased since January 4, and MUF values are gradually declining.
The solar coronal holes, which now extend along the southern half of the central meridian, should contribute to a slight increase in the speed of the solar wind in the coming days.
In conclusion, the best news is that we expect a recurrent increase in solar activity around mid-January.
Visit the SolarHam website by VE3EN, long-term valued not only by radio amateurs but by professional astronomers. — F.K. Janda, OK1HH
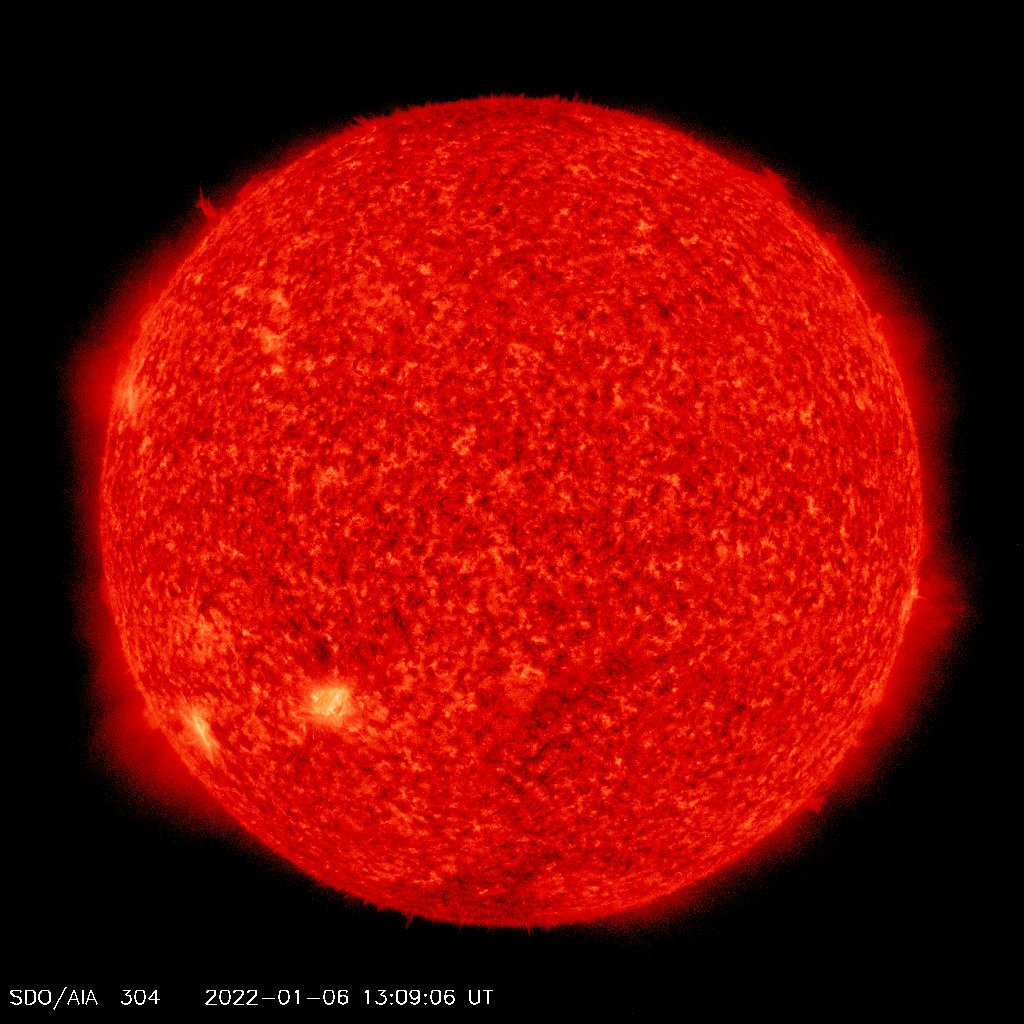
I frequently check the STEREO satellite website to peer over the sun’s horizon to see what might emerge over the next few days. I look for those messy white splotches, which may indicate magnetic complexity and perhaps a returning or emerging sunspot.
Although the image is constantly updated (every few minutes) presenting views of the sun in real time, in October 2014 communication with the STEREO-B spacecraft was lost, so we no longer see a full 360° image of the sun.
I’ve been wondering how much it would cost to replace the failed spacecraft and if there might be any plans to do so. I checked with someone at NASA, and received this interesting response:
“I don’t know exactly how much it would cost to build a single spacecraft to replace STEREO-B at this point.
“The two spacecraft combined (A and B) were about $550 million back before STEREO launch in 2006.
“There is no plan to replace STEREO-B, but based on the success of the STEREO mission there are a lot of people proposing missions observing the Sun and solar wind from spacecraft at the relatively stable Sun-Earth L4 and/or L5 points or else other spacecraft orbiting the Sun. We will see if any of them are funded. The exact cost would depend on the details of the mission.”
L4 and L5 refer to Lagrange points.
Jon Jones, N0JK, in Lawrence, Kansas wrote:
“January 3 was a big day for the VHF bands.
“The Quadrantid meteor shower appeared to peak around 2030 UTC January 3, as per the NASA prediction.
“I logged N0LL/P DM89 (353 miles) at 1950 UTC on 50.260 MHz MSK144. Then KE8FD (EN80, 779 miles) also 50.260 MSK144. Logged KA9CFD (EN40, 993 miles) on FT8, too far for groundwave; may have been meteor enhanced.
“That evening there was a strong sporadic-E opening across North America. I had a 6 meter PSK flag from ZF1EJ (EK99, 1573 miles) at 2357 UTC. Later worked N7BHC in rare EL15 (829 miles, Brownsville, Texas) at 0246 UTC.”
Jon writes the monthly “World Above 50 MHz” column in QST, and operates from grid square EM17 in Kansas.
More good 10-meter news from Greg Mitchell, KB1AWM, in Goose Creek, South Carolina:
“Just wanted to report a very favorable afternoon on 10 meters on December 27. Worked 4 VK stations back to back from South Carolina starting about 3:30 PM local (2030 UTC). Antenna was a simple longwire. VK4ZC started the run. He copied me at –06, and I gave him a –15 report. VK3BOX, VK2HFP, and VK3KJ followed, with the last one issuing me a +04. Great Christmas surprise on 10 meters. Over the past several years, I have never worked that easily into the South Pacific on 10.”
On January 6, WJ5O posted to an HF beacon email list:
“It’s mid-morning in Southern Alabama, and I’m hearing beacon signals a bit earlier than usual.
“1549 – 1559 UTC, 6 January 2022, I can hear/identify five 10-meter beacon signals into EM71as.
“28.2082 AK2F, RANDOLPH, NJ, 885 miles
“28.234 K4DP, COVINGTON, VA, 534 miles
“28.236 W8YT, MARTINSBURG, WV, 691 miles
“28.270, WA3NFV, FAIR HILL, PA, 838 miles
“28.296 W3APL, LAUREL, MD, 733 miles”
Al, W1VTP, in New Hampshire wrote on January 5:
“Last night was the pits [on 75 meters]. We did all our communications using the Washington SDR, and it was mostly successful. Point-to-point communication [was] useless.”
I think what happened was that the ionosphere directly above his area was not dense enough to reflect 75-meter signals. We may think of local 75-meter signals depending on ground wave propagation, but in fact it may depend on high-angle signals reflected from the overhead ionosphere.
Sunspot numbers for December 30 – through January 5 were 77, 53, 52, 25, 12, 12, and 24, with a mean of 36.4. The 10.7-centimeter flux was 102.4, 101.5, 93.9, 89, 84, 85.5, and 83.7, with a mean of 91.4. Estimated planetary A indices were 8, 4, 11, 10, 12, 6, and 3, with a mean of 7.7. Middle latitude A index was 7, 2, 9, 7, 9, 5, and 3, with a mean of 6.
For more information concerning radio propagation, visit the ARRL Technical Information Service, read “What the Numbers Mean…,” and check this propagation page by Carl Luetzelschwab, K9LA.
A propagation bulletin archive is available. For customizable propagation charts, visit the VOACAP Online for Ham Radio website.
Instructions for starting or ending email distribution of ARRL bulletins are on the ARRL website.
Share your reports and observations.
Photo Gallery
Back


